Women in Idaho – and the rest of the nation – are waiting longer to marry and have children, resulting in fewer babies, more time for education and more single parents than in past generations.
Demographic trends affect consumer spending, household economics, work-family balance and the long-term growth and composition of the labor force. Below are some of the trends for births and marriages in Idaho and the rest of the United States.
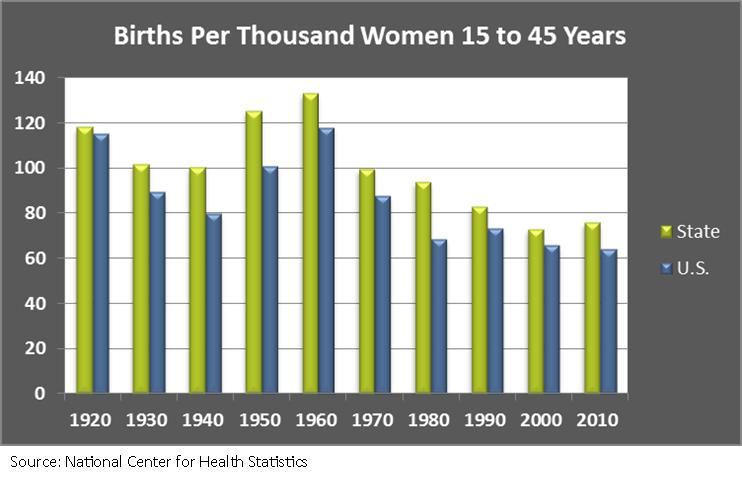
Recession exacerbates long-term decline in birth rates
The number of babies born in the United States remained flat in 2012, the first time in five years it did not significantly decline. From 2007 to 2011, the fertility rate – the number of babies born per 1,000 women ages 15 to 44 – fell 9 percent to a record low 63.2. The biggest declines in births came from two groups deeply hurt by the recession – Hispanics and people in their 20s. Idaho experienced an even sharper decline in births but saw a turnaround sooner than the nation. After falling 15 percent from 83.4 in 2007 to 72.31 in 2011, Idaho’s fertility rate rose 1 percent to 72.8 in 2012.
Birth rates tend to rise and fall with economic cycles. The recession that began in December 2007 intensified a long-term decline in U.S. fertility.
The fertility rate fell by a fifth during the Great Depression of the 1930s.
In 2011, the Pew Research Center analyzed the drop in fertility by geography and found a strong link between falling fertility and economic malaise. The only state to show a slight increase in fertility between 2008 and 2009 was North Dakota, which had one of the lowest unemployment rates in the country.
As the economy continues to improve, some of the young people who postponed having children will be able to have babies, resulting in a small baby boom in the next few years.
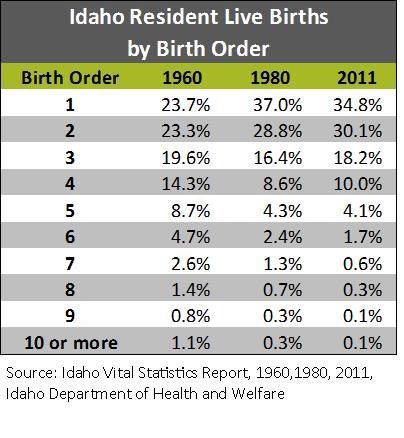
Women are having fewer children
Fertility rates fell sharply after 1960, one of the last four years of the baby boom. The availability of more reliable contraception methods and changing desires about family size pushed the fertility rate down over the next four decades.
At 2012 fertility rates, the average American women could expect 1.9 babies over her lifetime. That is below the “replacement rate” of 2.1 – the level at which enough children are born to replace their parents in the population. From 1990 to 2008, the U.S. fertility rate hovered above 2.1. At the same time most other developed countries saw sharp drops in their fertility rates, portending long-term population declines without high levels of in-migration.
Over the last five decades, Idaho women have reduced the number of children. In 1960, over 19 percent of Idaho births were to women who already have five or more children. By 2011, that had fallen below 7 percent.
Today, almost one in five American women end their childbearing years without having borne a child compared with one in 10 in the 1970s. While childlessness has risen for all racial and ethnic groups and most education levels, it has fallen over the past decade for women with advanced degrees. The most educated women remain the most likely never to bear a child. About 24 percent of women ages 40 to 44 with a master’s, doctorate or professional degree have not borne children – a decline from 31 percent in 1994.
Some women who do not bear their own children raise children as adoptive mothers or stepmothers. According to the 2012 American Community Survey, Idaho households were homes to 363,436 biological children, 17,665 stepchildren and 10,160 adopted children.
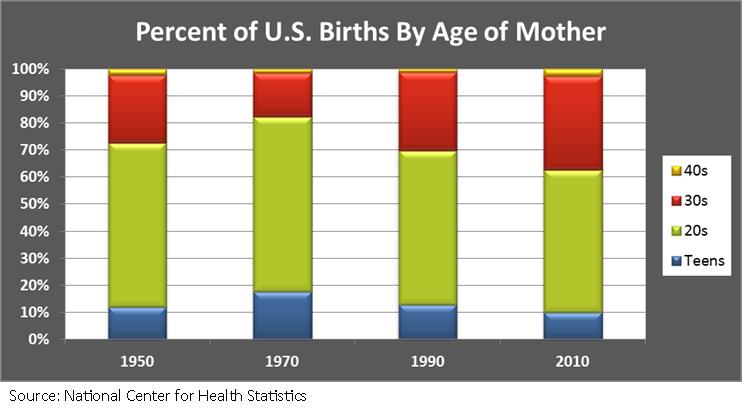
Women wait longer to have children
Over recent decades, women have been waiting longer to have their first child. Before 1950, the average age of a mother having her first child was 21. In 1970, the average age of an American woman when she bore her first child was 22.3. By 2011, it was 25.8. This delay of motherhood is associated with the growing educational attainment of women and the rising age for marriage. The more education a woman has, the later she tends to marry and have children. Idaho women tend to have their first child earlier. The average age of a first-time mother in Idaho from 2007 through 2009 was 23.9, while the average age of a first-time mother in the U.S. during the same period was 25.1.
Teen childbearing has been generally on a long-term decline in the United States since the early 1970s. Teen birth rates fell sharply throughout the 1990s until 2006 and even more sharply after the recession began in late 2007. In the U.S. the birth rate per 1,000 teenagers ages 15 to 19 fell to a record low of 31.3 in 2011. Fewer babies were born to teenagers in 2011 than in any year since the mid-1940s. In spite of these declines, the U.S. teen birth rate remains one of the highest among industrialized countries.
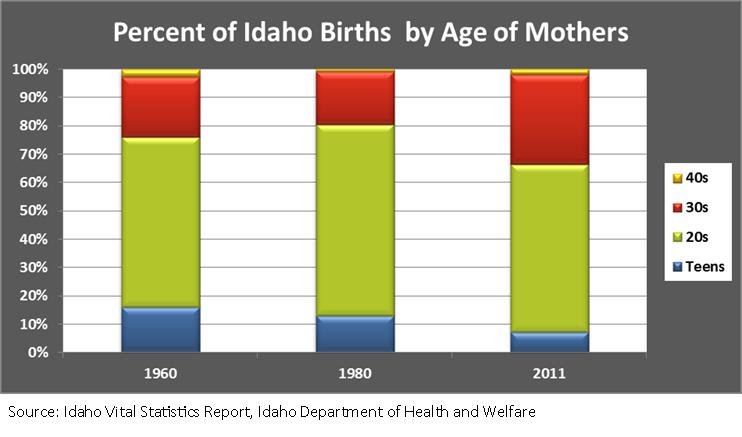
Idaho’s teen birth rate also fell over time. In 1960, for every 1,000 girls ages 15 to 19 years old there were 98.8 births. The rate declined to 61.1 in 1980, 51 in 1990, and 28.1 by 2011.
Women in their thirties now account for 35 percent of births in the U.S., compared to 16 percent in 1970. More women in their forties are giving birth for the first time, but they still make up only 1 percent of first births and 3 percent of all births. Teenagers account for 10 percent of today’s births, compared to 18 percent in 1970. Idaho saw similar changes in the age of mothers. In the 1960s, births to teens were primarily to married women 18 and over. In recent decades, births to teens more often are out-of-wedlock and involve proportionately younger teens.
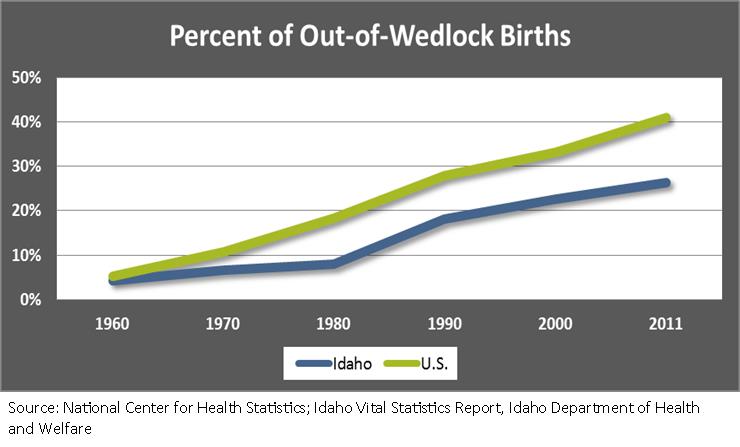
More than two in five American babies are born to unmarried parents
Since the late 1960s, out-of-wedlock birth rates have soared in the United States. In 1965, 24 percent of black infants and 3 percent of white infants were born to single mothers. By 1990 the rates soared to 64 percent for black infants, 18 percent for whites. By 2011, they had risen to 72 percent and 36 percent.
Idaho has not seen quite as steep a rise in out-of-wedlock births, partly because its nonwhite population is so small. Even so, more than one in four babies are born to unmarried mothers.
Before the 1970s, most unmarried mothers did not keep their babies. Today they put only a few up for adoption because the stigma of unwed motherhood has declined.
Over the last two decades, the number of out-of-wedlock births to teens has fallen dramatically while it has increased dramatically for other groups. Between 1990 and 2008, the rate of nonmarital childbearing among women in their 20s rose 27 percent.
In the last two decades, white women with some postsecondary education but no college degree have been responsible for much of the growth in out-of-wedlock births. As recently as 1990, only 10 percent of the births to women in this cohort occurred outside marriage, according to Child Trends. Now it has tripled to 30 percent compared with just 8 percent for women of all races with college degrees.
For high-school dropouts, 83 percent of first births are outside marriage, according to the National Center for Health Statistics.
Increasingly, the parents of a child born out of wedlock are living together, which means that at least initially most babies are living with both parents. According to the 2012 American Community Survey, about 65 percent of the Idaho women who gave birth in the previous 12 months were living with an unmarried partner. Nationally, the number was closer to about 72 percent, but couples who are not married when they have children are far more likely to split up. About 39 percent of cohabiting parents split up by the time their first child turns five years old – three times higher than the rate for parents who were married when they had their first child.
The era of the shotgun wedding has passed. About 18.1 percent of all single women who became pregnant opted to move in with their boyfriends before the child was born, according to 2006-2010 data from the government’s National Survey of Family Growth. That is compared with 5.3 percent who chose a post-conception marriage.
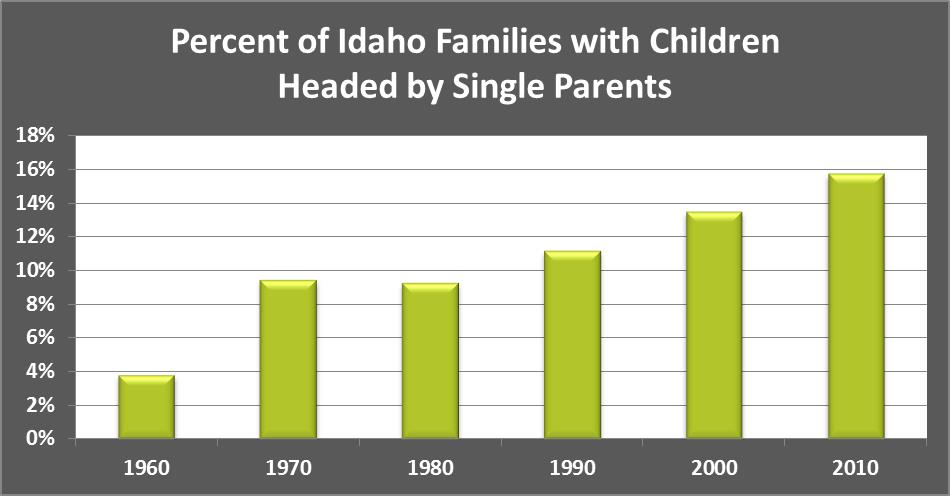
More children living with single parents
Given the rising out-of-wedlock birth rate and the increase in divorce rates since the 1960s, an increasing number of American children are growing up in single-parent homes. In 2010, about 32 percent of families with children under 18 were headed by single parents. In Idaho, nearly 16 percent were, compared to 4 percent in 1960.
Affording a child is harder
The cost of raising a child born in 2013 to age 18 averages $241,080, according to the U.S. Department of Agriculture. Its estimates include expenses for housing, food, transportation, clothing, health care, education and child care and miscellaneous expenses such as toys and computers. Since 2000, the cost of child care has increased twice as fast as the median income of families with children, according to the most recent report from Child Care Aware of America.
Many economists argue that the rise of single-parent families is a contributing factor to the growing inequality of income and wealth in the U.S. Children raised by a single parent are more likely to live in poverty, drop out of high school, become teen parents and raise their own children in poverty.
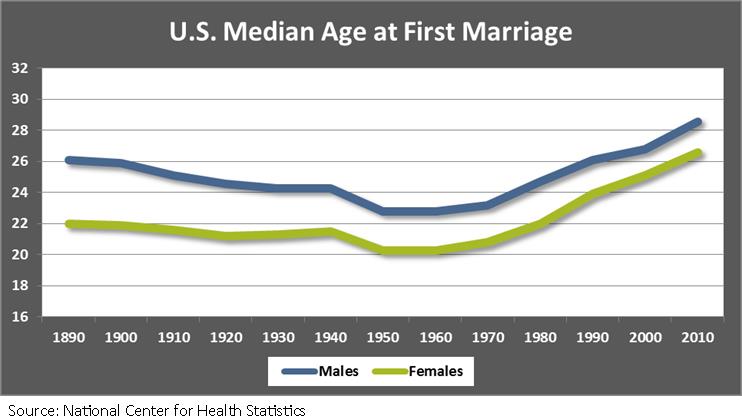
Waiting to marry
Americans are also marrying later. The average age for first marriages in the United States was 26.5 for women and 28.7 for men in 2011, up from 21 for women and 23 for men in 1990 and 20 and 23 in 1960.
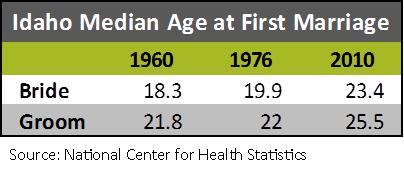
Women also are waiting longer in Idaho to get married. Idaho and Utah take turns having the lowest median ages for first marriages.
It used to be that only college-educated women waited to marry. Now it’s all groups, as the chart below shows.
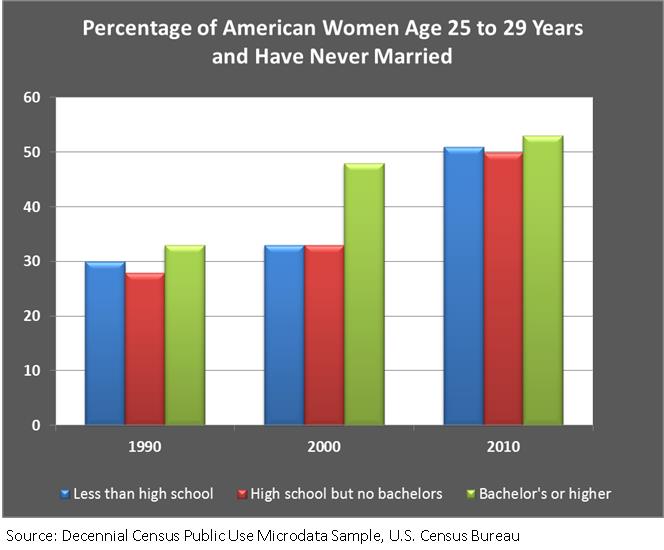 Knot Yet: The Benefits and Costs of Delayed Marriage in America, a 2013 report from the National Marriage Project at the University of Virginia, found women who wait until age 30 to marry make more money. Women with a college degree who wait to marry until at least age 30 earn $18,152 more a year than college-educated women who married before age 20. Women with high school diplomas but no college degrees earn $4,052 if they marry after age 30 than those who married before age 20.
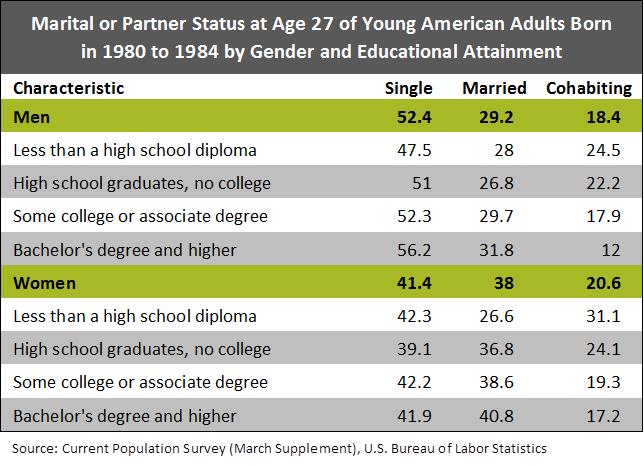
It appears a greater percentage of college-educated young adults are choosing to marry than their less-educated peers. 2007 was the first year in American history when marriage rates were higher for college grads than non-grads over the age of 30. Nowadays, college graduates are more likely than those with less education to be married by age 27. Among young American adults who were born in the early 1980s, 34 percent were married at age 27, while 20 percent were unmarried and living with a partner, or cohabiting, and 47 percent were single. On average, young adults with more education were more likely to be married and less likely to be cohabiting.
The average age for childbearing is now younger than the average age for marriage.
In the late 1980s, the U.S. median age for first birth was higher than the median age for first marriage of women. While both ages have increased since, their position has reversed. In 2011, the median age was 25.8 for first births and 26.5 for first marriages. By age 25, 44 percent of women have had a baby, while only 38 percent have married.
Idaho hasn’t made this crossover. Its median age for first marriage remains lower than the median age for first birth.
Kathryn.Tacke@labor.idaho.gov, Regional Economist
(208) 799-5000 ext. 3984