While average wage gains seem to fit in an orderly pattern over the past 10 years, large differences exist in how these gains have been distributed among lower and higher wage earners.
Average wage increases provide one view of an economy’s current situation but looking at wages by percentiles shows where hourly income growth and declines are occurring.
Each percentile represents 1% of the labor force with hourly wages arranged in order from least to greatest. For example, the 10th percentile represents wages paid to the lowest 10% of the labor population. Wages in the 90th percentile are those paid to 90% of the working population. Any wages above the 90th percentile represent the top 10% of total wage earners.
The 50th percentile, also called the median, represents the midpoint value in a data series where half of the values (wages in this case) are below and half are above. The median differs from the average, which is calculated by adding up all the individual values and dividing the total by the number of values. The average wage may be a great tool for gauging overall change trends, but this figure can also be skewed by significant outliers on either extreme of wage distribution.
This analysis focuses on Idaho’s median wages for each of the percentiles reported by the U.S. Bureau of Labor Statistics: 10%, 25%, 50%, 75% and 90%.
Idaho’s 2021 average hourly wage gain of 2.4% looks like a typical year as it falls between the recent five-year annual average wage growth rate of 2.7% (2016-2021) and the 10-year average annual growth rate of 2.2% (2011-2021)[1]. When wages are viewed by percentiles, it becomes apparent lower income earners are realizing higher wage gains while higher-income earners are lagging.
From 2020 to 2021, Idaho experienced double-digit wage growth of more than 10% for both the 10th percentile and 25th percentile earners. Meanwhile, the 90th percentile experienced a wage decline of 4.2%. This is the first decline for the 90th percentile since it fell 0.1% in 2012. The 50th percentile, or median wage earner, experienced minimal wage growth of 1.5%. The 75th percentile gained 4.8% in hourly pay.
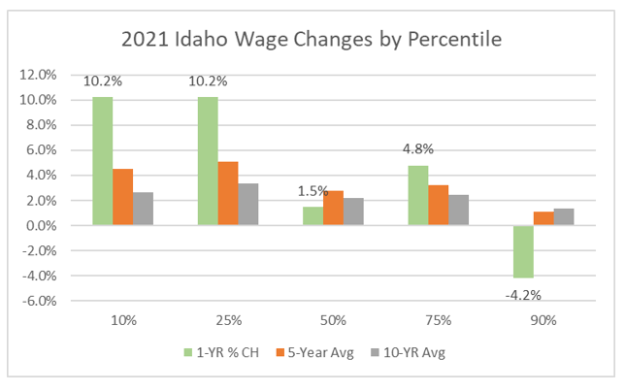
From 2016-2021, the 10th and 25th percentiles showed significant annual wage increases of 4.5% and 5.1%, respectively. In comparison, the 90th percentile gained a minimal 1.1%. This data demonstrates Idaho’s lower income earners have experienced higher wage growth than those in the upper income limits. This is true for both the short-term one-year gain in 2021 and the longer-term five-year period from 2016-2021.

Why are wages for lower earners rising faster than those for high earners?
- The labor market is tight. So far in 2022, Idaho has set record low unemployment rates for three consecutive months — February, March and April. Lowest-paid positions in retail, hospitality and physical labor occupations are some of the most numerous in Idaho’s economy. These are also some of the hardest to fill because of higher-than-average turnover rates due to seasonal layoffs, less-than-ideal schedules and minimal benefits. There are also more than two job listings per each unemployed person. This adds another layer of difficulty for employers to find and retain talent in these occupations. Leaving these positions vacant likely results in reduced open hours and loss of orders as well as customers losing patience. The high number of job openings in today’s labor market means job seekers have powerful leverage and greater choice of where they want to work. By increasing wages for these positions in a meaningful way, employers are seeking to counteract the tight labor market and attract the employees needed to keep their businesses operational.

- Lower wage earners feel inflation more directly than higher wage earners. Low wage earners in the 10th and 25th percentiles are much more likely to be negatively affected by rising rental rates, gas prices and food costs. These costs represent a higher percent of their monthly income than it does for higher wage earners. The Consumer Price Index (CPI) was up 7.1% in 2021 over 2020 and is expected to rise 4-6% in 2022. As a result, lower wage earners most likely will be the first to change positions and seek higher pay to avoid having to choose between purchasing essentials and paying their debts.
- Salaried employees can “top out” of their approved wage ranges. Higher wage earners in salaried positions are more likely to hit a wage ceiling that results in slower growth over time.
Comparison of Idaho’s 10th percentile with the federal minimum wage of $7.25
Since 2009, Idaho’s minimum wage has mirrored the federal minimum wage of $7.25 per hour. In 2008, when minimum wage was still $6.55 per hour, wages at the 10th percentile in Idaho were $7.71 – 6% above the soon-to-be minimum wage of $7.25. In 2021, the 10th percentile earnings were 48% above the minimum wage — still at $7.25 — at $10.76 per hour.
Since 2008, Idaho’s 10th percentile and 25th percentile wages have each increased by about 40% while the 90th percentile has experienced only half that level of growth. This means that since 2007 the labor market has adjusted upwards to its own “market minimum wage.”
Employers appear to be paying wage levels that workers are willing to accept rather than the current federally set minimum. It’s estimated fewer than 5% of Idaho’s employed workers are hired at the federal minimum wage of $7.25 per hour. Those workers also are likely to choose better-paying options in today’s tight labor market.

Regional wage comparison with Idaho’s neighbors
Compared with neighboring states of Nevada, Montana, Wyoming and Utah, Idaho’s wage percentiles were similar — between 95%-100% for most percentiles. At the 90th percentile, Idaho workers earned 80%-100% of the highest-earning 90th percentile levels for these neighboring states. Approximately 75% or more of Idaho employed workers earned wages on par to those paid by similar workers in these four states. When compared with its regional peers, Idaho’s top 10% of earners had lower wages than most of our bordering states.
Compared with Oregon and Washington, Idaho’s percentiles ranged significantly lower at between 60%-80% of wages paid in either of these states. However, cost-of-living levels may account for some of the difference in wages. The U.S. cost-of-living index is set at a baseline of 100. In 2021 Montana and Nevada were in the mid-range of 95-110, and Oregon and Washington were higher at 110+[2]. Idaho, Wyoming and Utah were indexed lower than 100, meaning cost of living was lower in these states.

Idaho’s occupations with highest one-year average wage growth rate
From 2020-2021, approximately 30% of Idaho’s occupations had an average hourly wage increase of $1 or more. More than 70% of these occupations earned less than $30 an hour. These occupations included health care practitioners; truck drivers; life, physical and social sciences; educational instruction; and farming, fishing and forestry[3].
Occupations seeing an average hourly wage decrease of at least $1 year over year generally had higher wages, with 80% paying more than $20 per hour and 45% paying more than $30 per hour. These occupations included lawyers, judges, architects, engineers and management.
Idaho occupational snapshot – Top wage gainers/losers from 2020-2021 by total wage change
 Lisa.Grigg@labor.idaho.gov, regional economist
Idaho Department of Labor
(208) 799-5000 ext. 3849
[1] Bureau of Labor Statistics, Occupation and Wage Survey
[2] World Population Review, “Cost of Living Index by State 2022”
[3] Bureau of Labor Statistics, Occupation and Wage Survey